scott padgett
Design systems leader making complexity scale

Two Systems, One Codebase,
zero breathing room
Role
Lead UX Product Designer, Manager focused on design systems, governance, and design to dev alignment.
Partners
Design system team, platform engineering, Order Insights and Order Builder product teams, accessibility specialists.
Executive Summary

We consolidated CarMax product surfaces from the in-house Horizon system to MUI with Material Design 3 theming to speed delivery, raise accessibility consistency, and cut bespoke maintenance. The move aligned tokens and theming across teams and reduced variance in common components.
Why we moved
Speed to market
Improving Speed and Productivity
PR Lead Time
3.0

1.0
DAYS
Significant reduction in pull request time
First Review
1.8
0.6
DAYS
Faster feedback cycles for developers
PR Lead Time
3.0%

1.0%
Significant reduction in pull request time:
Days
Accessibility at Scale
Ensuring Universal Access
Axe Violations
22
8.0
DAYS
Substantial decrease in automated accessibility
First Review
72%
95%
DAYS
Enhanced Keyboard Navigation
Talent on Boarding
14d
5d
Significant reduction in pull request time:
Days
“Another design library”
This was products 4th design system that was being proposed. Our development team had grown to protect their products vs blindly upgrade.
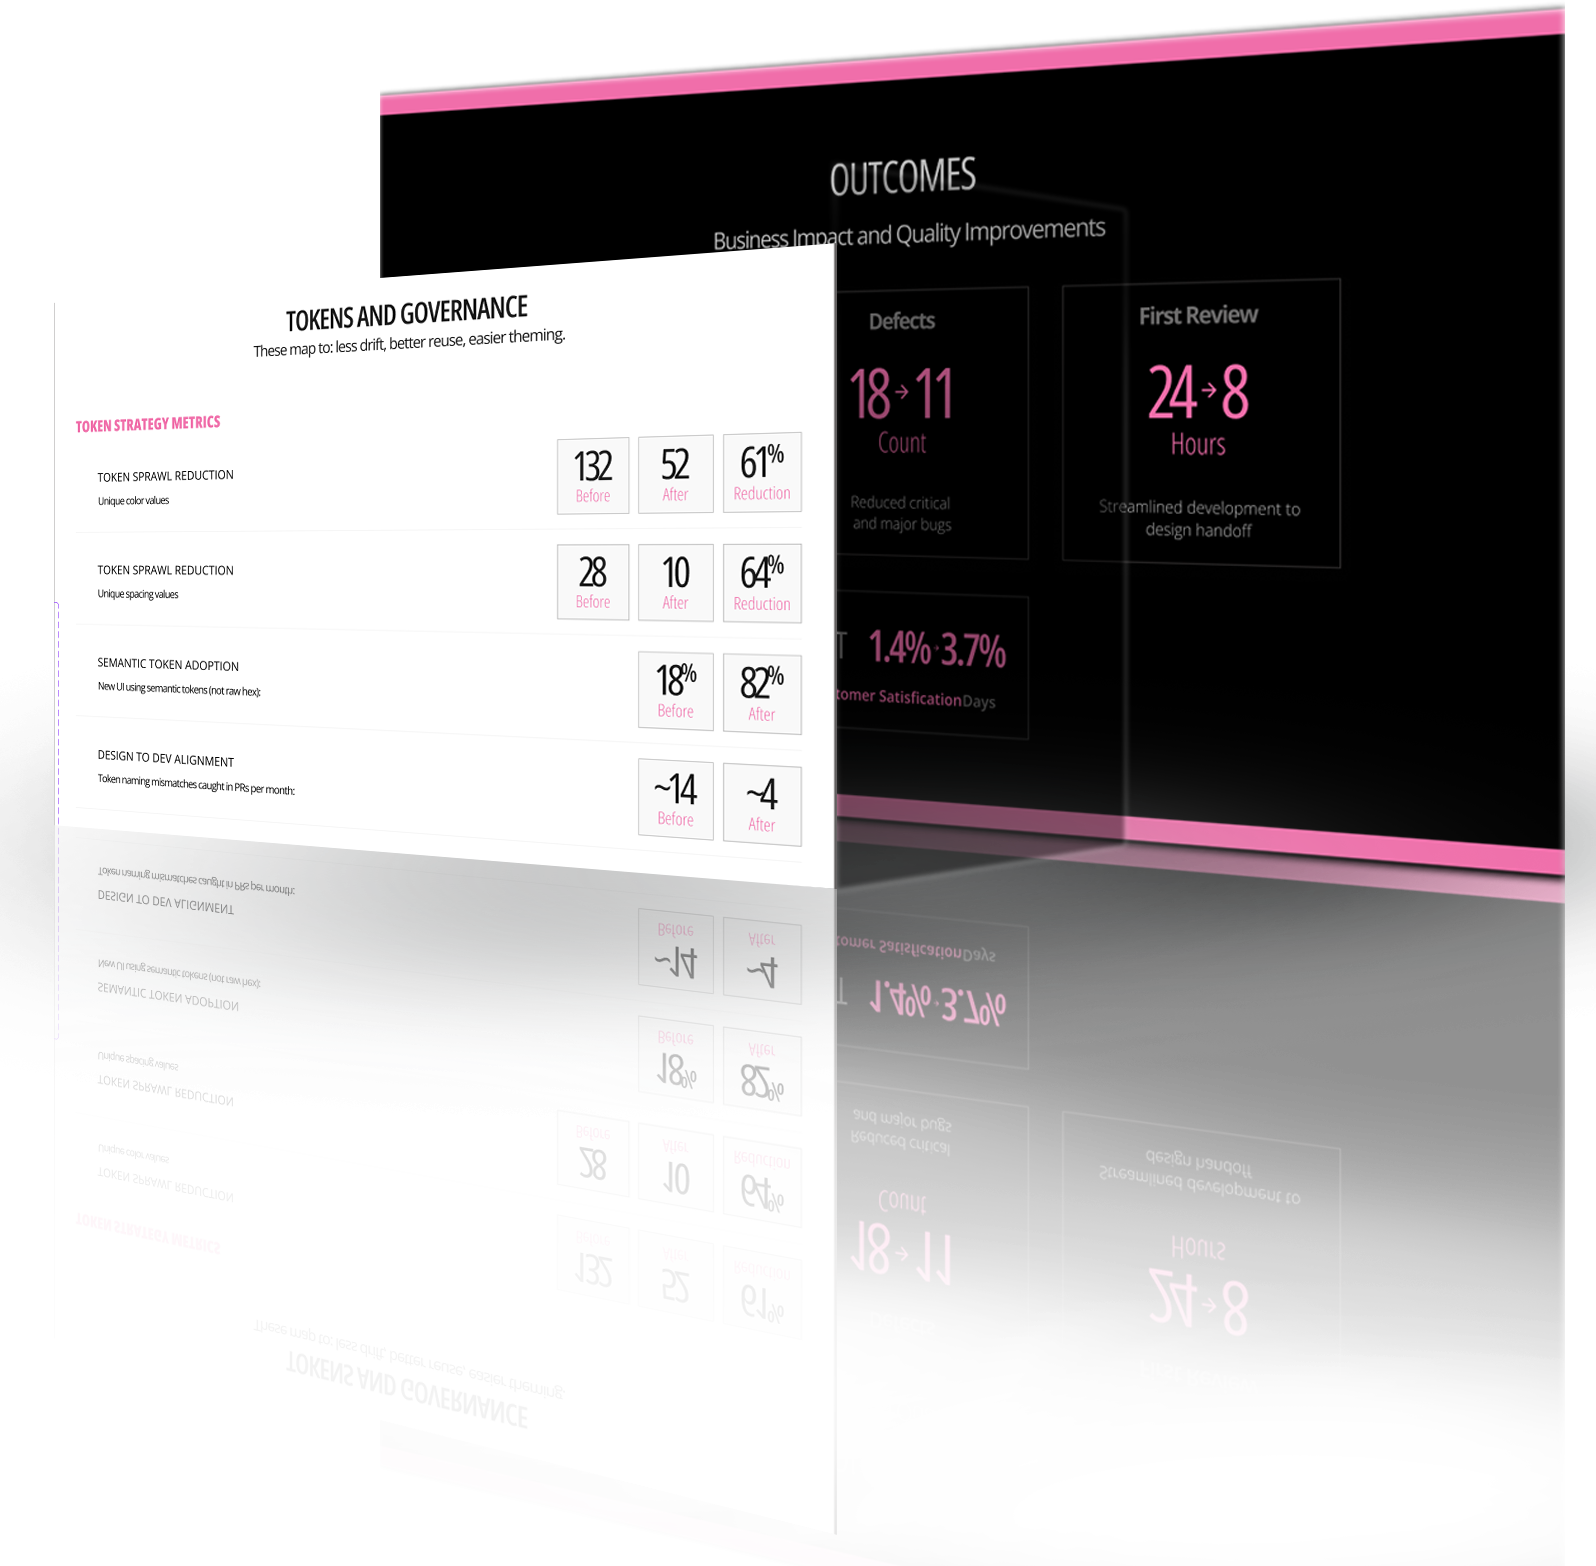
OUTCOMES
Business Impact and Quality Improvements
Release Frequently
1.2

2.5
Week
More frequent and reliable deployments
Defects
18
11
Count
Reduced critical and major bugs
First Review
24
8
Hours
Streamlined development to design handoff
CSAT
1.4%

3.7%
Customer Satisfication
Days
Tokens and Governance
These map to: less drift, better reuse, easier theming.
Token Strategy Metrics
Token sprawl reduction
Unique color values
132
Before
52
After
61%
Reduction
Token sprawl reduction
Unique spacing values
28
Before
10
After
64%
Reduction
Semantic token adoption
New UI using semantic tokens (not raw hex):
18%
Before
82%
After
Design to dev alignment
Token naming mismatches caught in PRs per month:
~14
Before
~4
After
Governance Metrics
Time to decision on token or component changes
Average time from request to decision:
21
Before
7
After
Governance coverage
Changes that go through the formal intake process:
~35%
Before
~8%
After
Breaking change impact
Breaking design system changes per quarter that required hotfixes:
6
Before
2
After
Migration and Consistency Metrics
Migration effort saved
Average effort to rebrand or restyle a screen:
28
Before
10
After
64%
Reduction
scott padgett
Design systems leader making complexity scale
Home
About
Work
Contact

Two Systems, One Codebase,
zero breathing room
Role
Lead UX Product Designer, Manager focused on design systems, governance, and design to dev alignment.
Partners
Design system team, platform engineering, Order Insights and Order Builder product teams, accessibility specialists.
Executive Summary

We consolidated CarMax product surfaces from the in-house Horizon system to MUI with Material Design 3 theming to speed delivery, raise accessibility consistency, and cut bespoke maintenance. The move aligned tokens and theming across teams and reduced variance in common components.
Why we moved
Speed to market
Improving Speed and Productivity
PR Lead Time
3.0
1.0
DAYS
Significant reduction in pull request time
First Review
1.8
0.6
DAYS
Faster feedback cycles for developers
PR Lead Time
3.0%
1.0%
Significant reduction in pull request time:
Days
Accessibility at Scale
Ensuring Universal Access
Axe Violations
22
8.0
DAYS
Substantial decrease in automated accessibility
First Review
72%
95%
DAYS
Enhanced Keyboard Navigation
Talent on Boarding
14d
5d
Significant reduction in pull request time:
Days
“Another design library”
This was products 4th design system that was being proposed. Our development team had grown to protect their products vs blindly upgrade.
OUTCOMES
Business Impact and Quality Improvements
Release Frequently
1.2
2.5
Week
More frequent and reliable deployments
Defects
18
11
Count
Reduced critical and major bugs
First Review
24
8
Hours
Streamlined development to design handoff
CSAT
1.4%
3.7%
Customer Satisfication
Days
Tokens and Governance
These map to: less drift, better reuse, easier theming.
Token Strategy Metrics
Token sprawl reduction
Unique color values
132
Before
52
After
61%
Reduction
Token sprawl reduction
Unique spacing values
28
Before
10
After
64%
Reduction
Semantic token adoption
New UI using semantic tokens (not raw hex):
18%
Before
82%
After
Design to dev alignment
Token naming mismatches caught in PRs per month:
~14
Before
~4
After
Governance Metrics
Time to decision on token or component changes
Average time from request to decision:
21
Before
7
After
Governance coverage
Changes that go through the formal intake process:
~35%
Before
~8%
After
Breaking change impact
Breaking design system changes per quarter that required hotfixes:
6
Before
2
After
Migration and Consistency Metrics
Migration effort saved
Average effort to rebrand or restyle a screen:
28
Before
10
After
64%
Reduction
scott padgett
Design systems leader making complexity scale
Home
About
Work
Contact
Two Systems, One Codebase,
zero breathing room
Role
Lead UX Product Designer, Manager focused on design systems, governance, and design to dev alignment.
Partners
Design system team, platform engineering, Order Insights and Order Builder product teams, accessibility specialists.
Executive Summary
We consolidated CarMax product surfaces from the in-house Horizon system to MUI with Material Design 3 theming to speed delivery, raise accessibility consistency, and cut bespoke maintenance. The move aligned tokens and theming across teams and reduced variance in common components.
Why we moved
Speed to market
Improving Speed and Productivity
PR Lead Time
3.0
1.0
DAYS
Significant reduction in pull request time
First Review
1.8
0.6
DAYS
Faster feedback cycles for developers
PR Lead Time
3.0%
1.0%
Significant reduction in pull request time:
Days
Accessibility at Scale
Ensuring Universal Access
Axe Violations
22
8.0
DAYS
Substantial decrease in automated accessibility
First Review
72%
95%
DAYS
Enhanced Keyboard Navigation
Talent on Boarding
14d
5d
Significant reduction in pull request time:
Days
“Another design library”
This was products 4th design system that was being proposed. Our development team had grown to protect their products vs blindly upgrade.
OUTCOMES
Business Impact and Quality Improvements
Release Frequently
1.2
2.5
Week
More frequent and reliable deployments
Defects
18
11
Count
Reduced critical and major bugs
First Review
24
8
Hours
Streamlined development to design handoff
CSAT
1.4%
3.7%
Customer Satisfication
Days
Tokens and Governance
These map to: less drift, better reuse, easier theming.
Token Strategy Metrics
Token sprawl reduction
Unique color values
132
Before
52
After
61%
Reduction
Token sprawl reduction
Unique spacing values
28
Before
10
After
64%
Reduction
Semantic token adoption
New UI using semantic tokens (not raw hex):
18%
Before
82%
After
Design to dev alignment
Token naming mismatches caught in PRs per month:
~14
Before
~4
After
Governance Metrics
Time to decision on token or component changes
Average time from request to decision:
21
Before
7
After
Governance coverage
Changes that go through the formal intake process:
~35%
Before
~8%
After
Breaking change impact
Breaking design system changes per quarter that required hotfixes:
6
Before
2
After
Migration and Consistency Metrics
Migration effort saved
Average effort to rebrand or restyle a screen:
28
Before
10
After
64%
Reduction